Visualizing x64dbg Trace Recordings
17 May 2026, by terraphax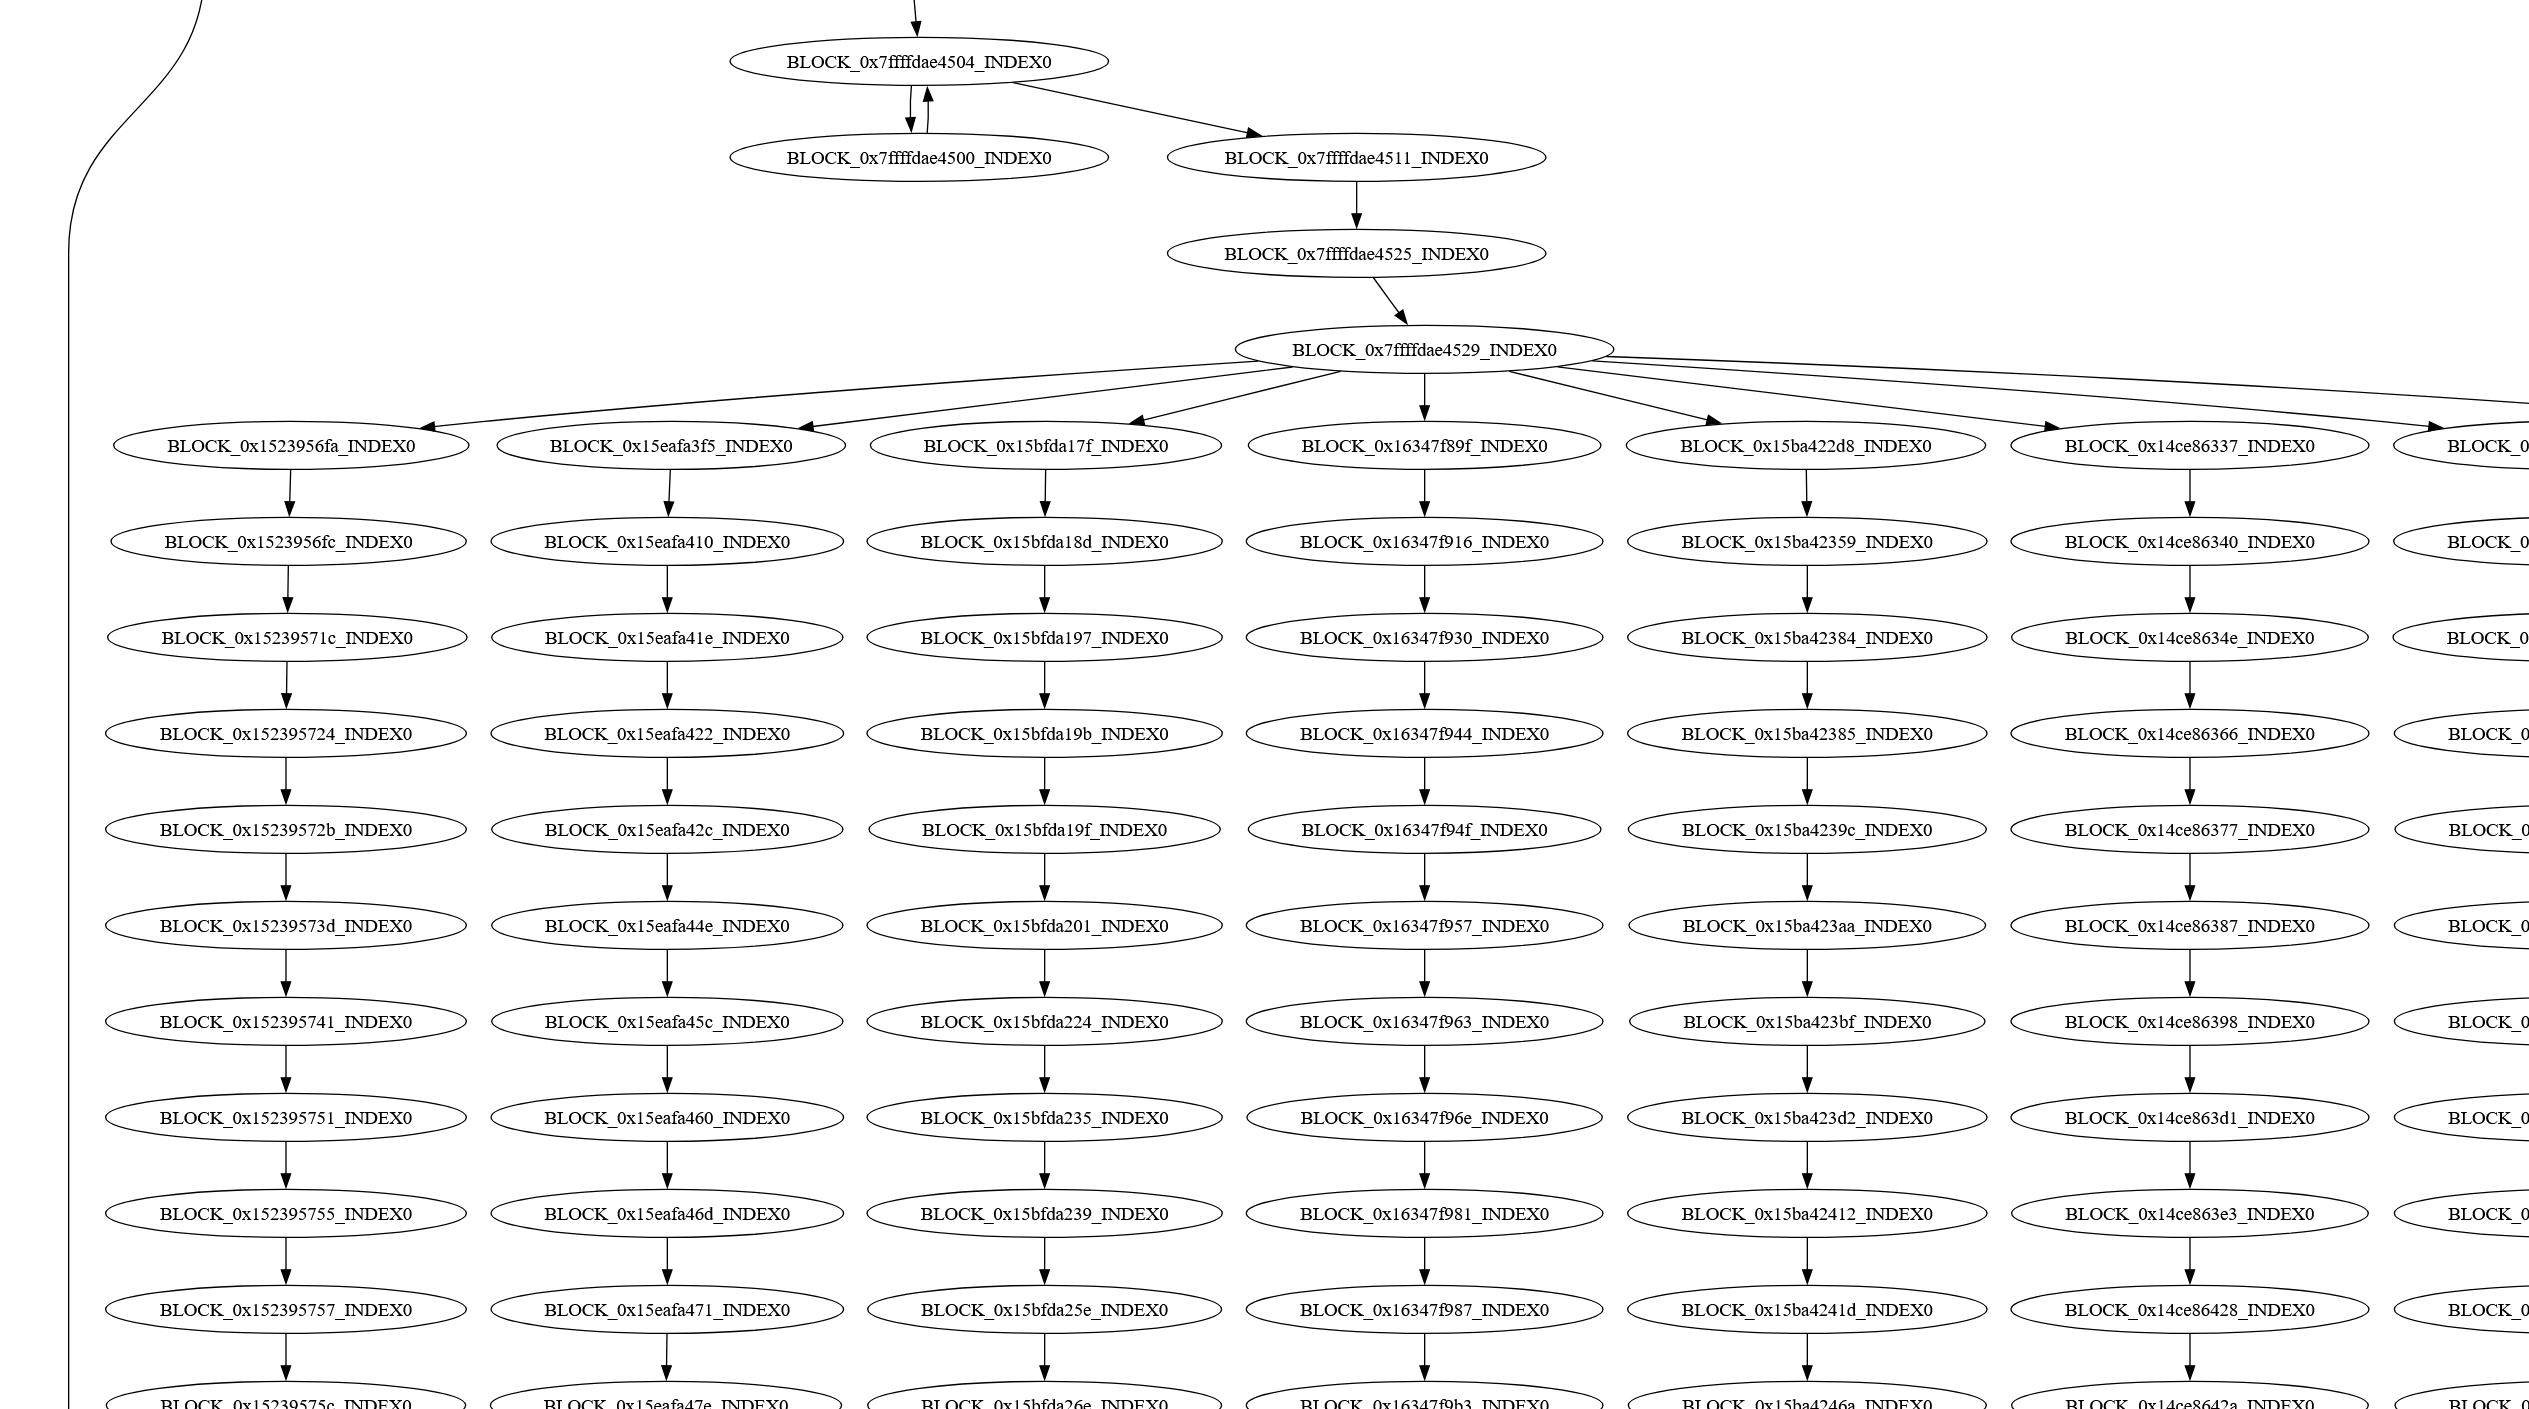
DISCLAIMER: This blog article was human generated.
Dear x64dbg Users,
The purpose of today’s issue of the x64dbg blog is to put on display the power that x64dbg grants you with respect to its Trace Recording feature. During my dive into this component of x64dbg, that I am told by mrexodia it was contributed in large part by torusrxxx, I found it interesting enough that I wanted the rest of the community to know about it, if not already, and hopefully come to appreciate it as well!
Initial Inspiration
The initial inspiration for diving into this feature was viewing the slides of a previous talk given at Recon 2024 that can be found here, where someone named Holger Unterbrink that worked for Cisco Talos put on display a graph of a commercial code virtualizing obfuscator.
I noticed how Holger had done it, and I wanted to try it as well, but instead make some of my own differing design decisions. Those differing decisions are those such as parsing the binary file instead of textual information, and only visualizing unique edges, rather than counting and displaying repeated flow to blocks of code.
Prior Art
Although I did not use these as reference, since I was unaware, it was brought to my attention that there is a lot of prior art on this subject matter already pertaining to x64dbg trace files as well.
- https://github.com/mibho/x64dbgTraceReader
- https://github.com/g0th1c54e4/x64dbg-trace-parser
- https://github.com/survivalizeed/TraceViewer
- https://github.com/teemu-l/execution-trace-viewer
- https://github.com/mrexodia/dumpulator/blob/main/tests/x64dbg-tracedump.py
A reader may enjoy rummaging through the contents of those repositories and their code.
Onto our own discussion now.
Surface Level
The way that x64dbg presents this feature through its GUI sells it quite short, as you will soon come to learn. Maybe many others are not surprised that there is more than meets the eye. The feature as its presented to the end-user is still quite impressive, though. What I want you to know is that it goes much further in the later sections I will share.
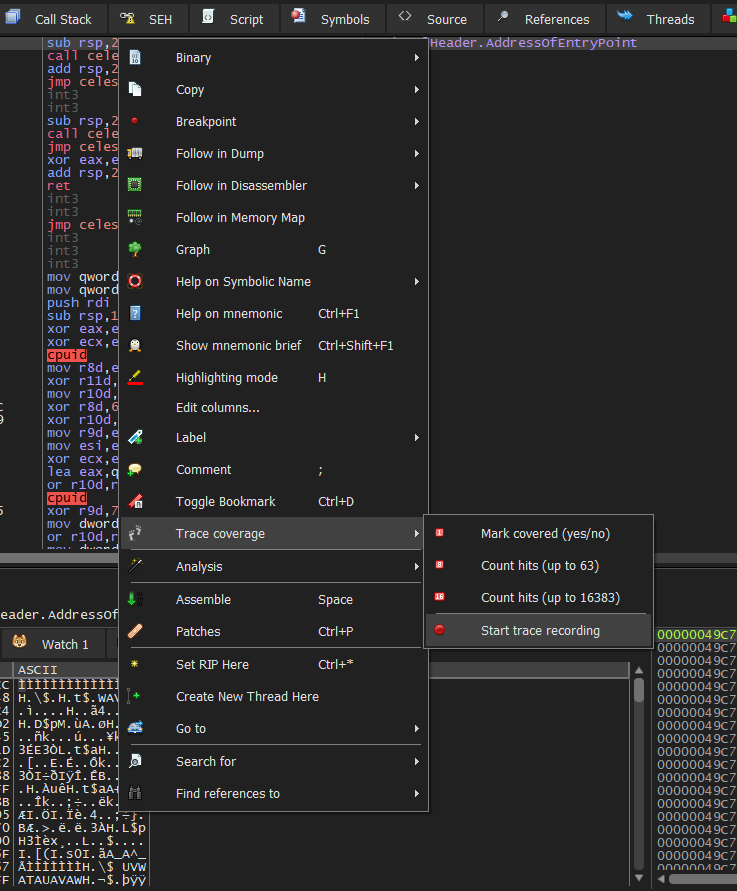
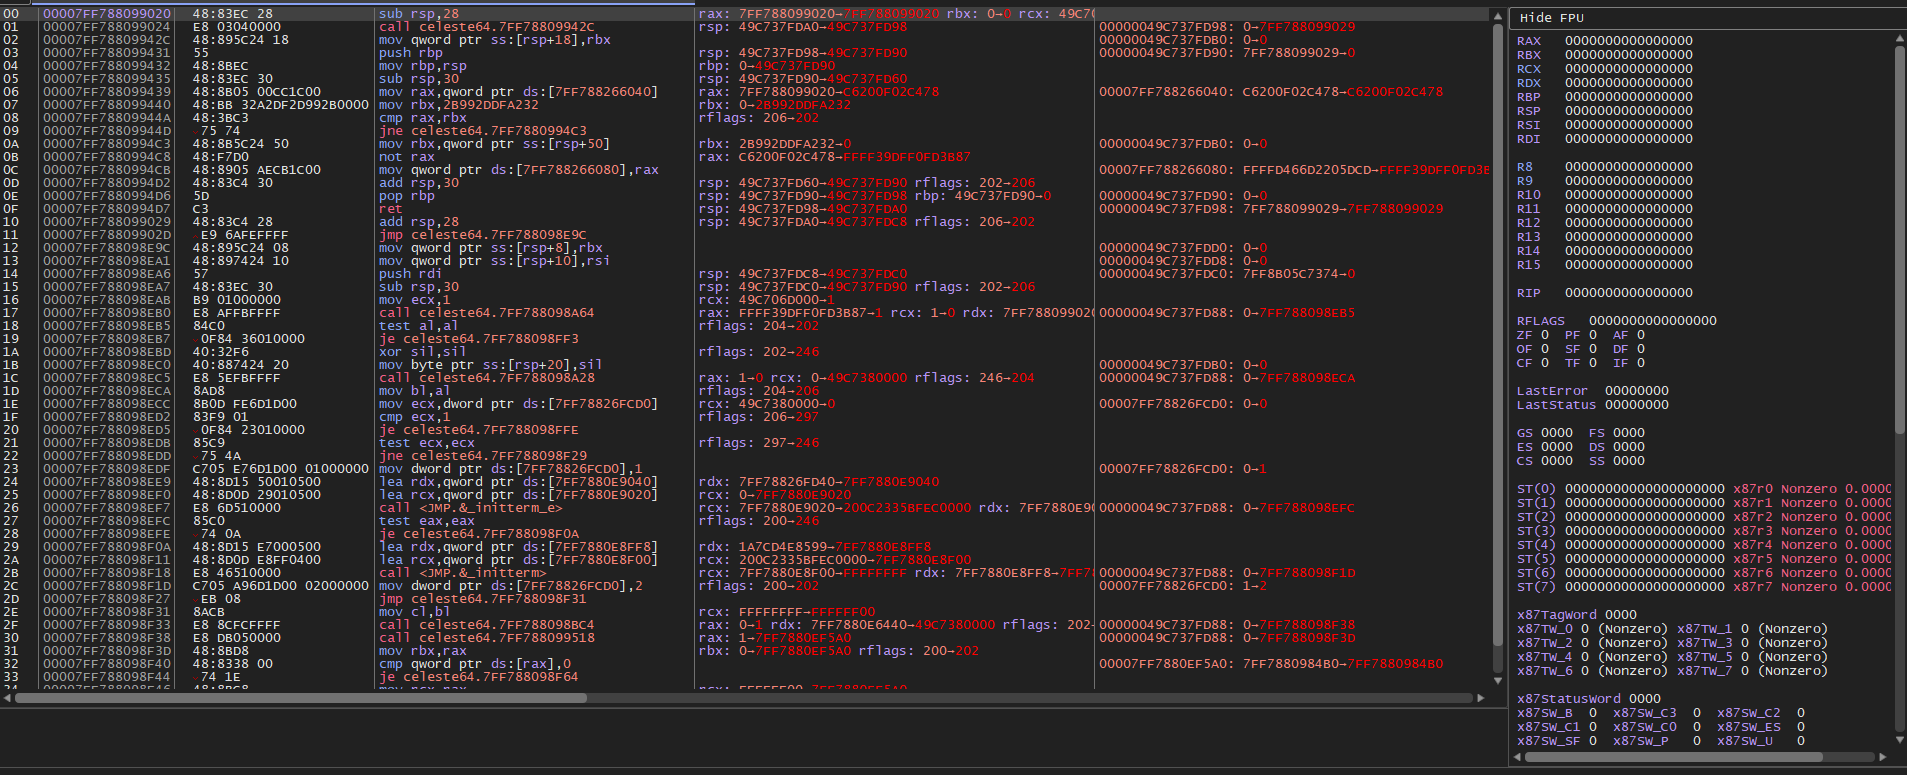
In essence, you can start a Trace Recording, trace through some instructions, end that recording, and then view a large list of what you have captured now in your output.
The usefulness of this feature seems dubious at best. In a trace of potentially millions of instructions, you will not have much luck finding what you are looking for in the GUI. At least from my experience, the GUI does not even have features that make it simple to find occurrences of specific instructions, or much of anything else aside from scrolling the recorded list.
As promised before though, there is more to this feature than the GUI. And it all starts when you first start the trace. You see, the prompt asks where you want to save the trace file.
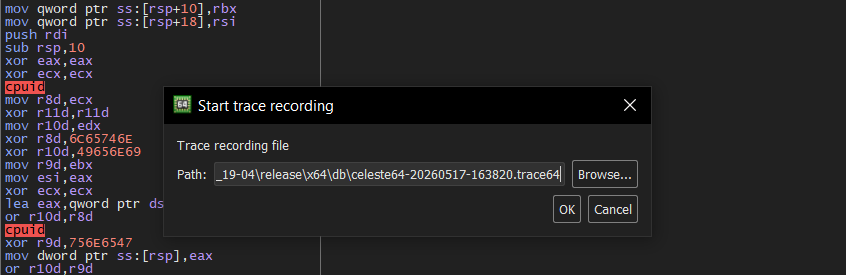
This trace file is stored in a very special binary format, and by the end of your trace is chock-full of a motherload of information that you can extract, and use for your own purposes.
Trace File Binary Format
Much of the documentation for the format of the trace file can be found here, but I will extrapolate further upon it.
Just as with most any file format, x64dbg’s trace files begin with a header.
Trace File Header
Here is a pattern in the form of a struct pseudocode.
struct X64DbgTraceFileHeader {
    char MagicWord[4];
    uint32_t JsonBlobLength;
    char JsonBlob[JsonBlobLength];
    // ... then the header is followed up by
    // any amount of trace blocks until reaching EOF
    BinaryTraceDataBlock blocks[0];
};
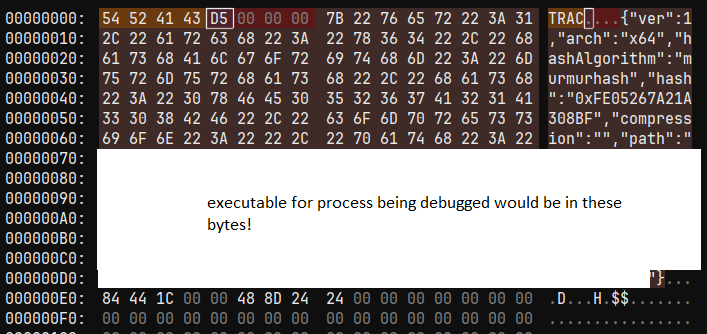
In sum, the header begins with a magic word, that should be equivalent to the ASCII string “TRAC”.
Then, a JSON blob is specified by its length and then a buffer of that length containing data that can be parsed as JSON. This JSON blob contains extraneous information, but most importantly, in the event that one does not know which version of x64dbg it was saved on (e.g. whether x32 or x64), there is an attribute that specifies which architecture the trace file was for. This enables software that parses the trace file to for example, select a different instruction decoder e.g. X86 instead of AMD64, when processing the binary trace data blocks.
Binary Trace Data Blocks
Here is a pattern in the form of a struct pseudocode.
struct BinaryTraceDataBlock {
    uint8_t Kind;
    union {
        // if Kind == 0
        struct {
            uint8_t RegisterChangesCount;
            uint8_t MemoryAccessesCount;
            uint8_t BlockFlagsAndOpcodeSizeBitfield;
            // only exists if flag is
            // set in BlockFlagsAndOpcodeSizeBitfield
            DWORD OptionalThreadId[(BlockFlagsAndOpcodeSizeBitfield & THREADID_MASK) != 0];
            uint8_t Opcode[BlockFlagsAndOpcodeSizeBitfield & OPCODE_MASK];
            uint8_t EncodedRegisterChangePositions[RegisterChangesCount];
            // duint is a type that, depending on the architecture, gets its size
            // for ex. on x32 the register length for a GPR is 32 bits, so uint32
            // but for x64 the GPR length is 64 bits, so uint64
            duint RegisterChangeNewData[RegisterChangesCount];
            uint8_t MemoryAccessFlags[MemoryAccessesCount];
            duint MemoryAccessAddress[MemoryAccessesCount];
            duint MemoryAccessOldData[MemoryAccessesCount];
            duint MemoryAccessNewData[/* number of memory accesses with flags indicating a memory write */];
        } InstructionExecution;
        // if Kind >= 0x80
        struct {
            uint32_t DataLength;
            uint8_t Data[DataLength];
        } Custom;
    }
};
Apologies for any mistakes made in haste of typing out this post, as it is mostly done on-the-fly, and the real matter is in the implementation, to be frank.
When it comes to binary trace data blocks, there are currently two kinds: one for a recorded instruction execution (when Block.Kind == 0), and another reserved for custom data insertion (when Block.Kind >= 0x80).
However, as one can tell, the binary trace data blocks are where it gets significantly more complex. The layout of this data structure owes its complexity in large part due to its design being meant to optimize for space, as well as for the compressibility of the information.
One way that the format is engineered for compressibility is in how the altered register positions (.EncodedRegisterChangePositions) are encoded. Information on how those register change positions are decoded will follow in the next section, along with implementation code.
In another aspect, the format saves on space by using bitfields and flags in clever ways. For example, the size of an opcode and whether the thread ID is available in the binary trace data block are encoded as one byte field, BlockFlagsAndOpcodeSizeBitfield, with the least significant 4 bits occupied by the opcode size, and the most significant bit indicating the presence of a thread ID. In another aspect, the MemoryAccessFlags help to determine whether a given memory access even modified memory whatsoever, and should be allowed to take up extra space in MemoryAccessNewData.
Trace Visualizer Implementation
For this project, I decided to dust off the Python. And for Python to even be useful for a task such as this, I leveraged the struct standard library module, official documentation on that here. Using Python required some heavy setup, so features such as dataclasses and NamedTuples were also utilized. I will save you from much of the boiler plate code that looks like this…
# ...

# ======================================================================================

BITMASK_IS_THREAD_ID_AVAILABLE: int = create_bit_mask(7)
BITMASK_OPCODE_SIZE: int = create_bit_mask_ex((0, 1, 2, 3))
BITMASK_IS_MEMORY_CHANGED: int = create_bit_mask(0)

BLOCKTYPE_CUSTOM_GE: int = int(0x80)
BLOCKTYPE_INSTRUCTION_EXECUTION: int = 0

# ======================================================================================

SF_UINT8: str = "<B"
SF_UINT16: str = "<H"
SF_UINT32: str = "<I"
SF_UINT64: str = "<Q"
SF_INT8: str = "<b"
SF_INT16: str = "<h"
SF_INT32: str = "<i"
SF_INT64: str = "<q"

SF_MAGIC_WORD: str = "<4s"

SF_JSON_BLOB_HEADER: str = SF_UINT32

SF_BINARY_TRACE_DATA_BLOCK_HEADER: str = SF_UINT8

SF_BINARY_TRACE_DATA_INSTRUCTION_EXECUTION_BLOCK_HEADER: str = "<BBB"
SF_BINARY_TRACE_DATA_CUSTOM_BLOCK_HEADER: str = SF_UINT32

# ======================================================================================

# ...
Decoding Register Change Positions
Now onto the first interesting part, as promised here is the algorithm for decoding the register change positions.
def decode_register_changes_to_absolute_indexes_inplace(encoded_idxs: List[int]):
    prev: int = 0
    addend: int = 0
    for i in range(len(encoded_idxs)):
        current: int = encoded_idxs[i] + prev + addend

        encoded_idxs[i] = current

        prev = current
        addend = 1
The encoding that x64dbg uses for these register change positions is incredible, because when a binary trace data block changes all registers, all entries in the array before decoding are just a bunch of zeros. Yes, 0s…
This means that compression is trivial, as you can just compress the data by specifying what data was there. Say, a 0. And then appending the number of times that data should have existed previously in the stream. Say that there were 255 zeroes. You can instead encode 255 bytes as 2, 00 FF.
Tracking Instruction Execution
To ease processing of instruction executions, I implemented a context to allow myself to track the state of the program, at least as much as is possible.
class InstructionExecutionContext:
    def __init__(self, arch: Architecture):
        self.__arch: Architecture = arch

        self.__reg_state: Dict[int, int] = {}

        self.__last_instr_ip: int = -1
        self.__last_thread_id: int = -1

    def process_instruction(self, iebr: InstructionExecutionBlockResult):

        if iebr.is_thread_id_available:
            self.__last_thread_id = iebr.thread_id

        iebr_changes_ip: bool = False
        match self.__arch:
            case Architecture.X64:
                if iebr.reg_changes.get(IP_REGISTER_ABSOLUTE_INDEX_X64) is not None:
                    iebr_changes_ip = True
            case Architecture.X86:
                if iebr.reg_changes.get(IP_REGISTER_ABSOLUTE_INDEX_X86) is not None:
                    iebr_changes_ip = True
            case _:
                raise NotImplementedError

        for reg_abs_idx, reg_value in iebr.reg_changes.items():
            self.__reg_state[reg_abs_idx] = reg_value

        self.__last_instr_ip = self.ip

        if (
            not iebr_changes_ip
        ):  # advance our IP ourselves in-case our next instruction does not do it!
            self.ip = self.ip + iebr.opcode_size

    @property
    def last_instruction_thread_id(self) -> int:
        return self.__last_thread_id

    @property
    def last_instruction_ip(self) -> int:
        return self.__last_instr_ip

    @property
    def ip(self) -> int:
        match self.__arch:
            case Architecture.X64:
                return self.__reg_state[IP_REGISTER_ABSOLUTE_INDEX_X64]
            case Architecture.X86:
                return self.__reg_state[IP_REGISTER_ABSOLUTE_INDEX_X86]
            case _:
                raise NotImplementedError

    @ip.setter
    def ip(self, value: int):
        match self.__arch:
            case Architecture.X64:
                self.__reg_state[IP_REGISTER_ABSOLUTE_INDEX_X64] = value
            case Architecture.X86:
                self.__reg_state[IP_REGISTER_ABSOLUTE_INDEX_X86] = value
            case _:
                raise NotImplementedError

    @property
    def flags(self) -> int:
        match self.__arch:
            case Architecture.X64:
                return self.__reg_state[FLAGS_REGISTER_ABSOLUTE_INDEX_X64]
            case Architecture.X86:
                return self.__reg_state[FLAGS_REGISTER_ABSOLUTE_INDEX_X86]
            case _:
                raise NotImplementedError

    @property
    def zf(self) -> bool:
        return (self.flags & FLAGS_BIT_MASK_ZERO) != 0

    @property
    def pf(self) -> bool:
        return (self.flags & FLAGS_BIT_MASK_PARITY) != 0

    @property
    def of(self) -> bool:
        return (self.flags & FLAGS_BIT_MASK_OVERFLOW) != 0

    @property
    def cf(self) -> bool:
        return (self.flags & FLAGS_BIT_MASK_CARRY) != 0

    @property
    def af(self) -> bool:
        return (self.flags & FLAGS_BIT_MASK_AUXILIARY_CARRY) != 0

    @property
    def sf(self) -> bool:
        return (self.flags & FLAGS_BIT_MASK_SIGN) != 0
There is probably one small bug in here, and in general yet I did not properly support instructions of the REP(x/xx) variety, but that is quite simple at this point to do. I’m pretty sure that this line
if (
            not iebr_changes_ip
    ):  # advance our IP ourselves in-case our next instruction does not do it!
        self.ip = self.ip + iebr.opcode_size
has got to go.
Some nuance is here in the fact that depending on the architecture, the position for specific registers when changed can differ.
IP_REGISTER_ABSOLUTE_INDEX_X64: int = 16
IP_REGISTER_ABSOLUTE_INDEX_X86: int = 8

FLAGS_REGISTER_ABSOLUTE_INDEX_X64: int = 17
FLAGS_REGISTER_ABSOLUTE_INDEX_X86: int = 9
This is due to the following structures defined in the x64Dbg bridge source.
typedef struct
{
    REGISTERCONTEXT regcontext;
    FLAGS flags;
    X87FPUREGISTER x87FPURegisters[8];
    unsigned long long mmx[8];
    MXCSRFIELDS MxCsrFields;
    X87STATUSWORDFIELDS x87StatusWordFields;
    X87CONTROLWORDFIELDS x87ControlWordFields;
    LASTERROR lastError;
    LASTSTATUS lastStatus;
} REGDUMP;
One can even find further divergence with the #ifdef clauses present when representing the REGISTERCONTEXT struct.
typedef struct
{
    ULONG_PTR cax;
    ULONG_PTR ccx;
    ULONG_PTR cdx;
    ULONG_PTR cbx;
    ULONG_PTR csp;
    ULONG_PTR cbp;
    ULONG_PTR csi;
    ULONG_PTR cdi;
#ifdef _WIN64
    ULONG_PTR r8;
    ULONG_PTR r9;
    ULONG_PTR r10;
    ULONG_PTR r11;
    ULONG_PTR r12;
    ULONG_PTR r13;
    ULONG_PTR r14;
    ULONG_PTR r15;
#endif //_WIN64
    ULONG_PTR cip;
    ULONG_PTR eflags;
    unsigned short gs;
    unsigned short fs;
    unsigned short es;
    unsigned short ds;
    unsigned short cs;
    unsigned short ss;
    ULONG_PTR dr0;
    ULONG_PTR dr1;
    ULONG_PTR dr2;
    ULONG_PTR dr3;
    ULONG_PTR dr6;
    ULONG_PTR dr7;
    BYTE RegisterArea[80];
    X87FPU x87fpu;
    DWORD MxCsr;
#ifdef _WIN64
    XMMREGISTER XmmRegisters[16];
    YMMREGISTER YmmRegisters[16];
#else // x86
    XMMREGISTER XmmRegisters[8];
    YMMREGISTER YmmRegisters[8];
#endif
} REGISTERCONTEXT;
X64DbgTraceFile Mother Class
In the end though, the trace file in my implementation becomes consumable through an instance of a X64DbgTraceFile, initialized like so:
def __init__(
        self,
        file_data: bytes,
        arch: Optional[Architecture] = None,
    ):
        self.__file_data: bytes = file_data
        self.__arch: Architecture = Architecture.UNKNOWN

        current_offset: int = 0

        mwr: MagicWordResult = parse_magic_word(self.__file_data)
        current_offset = mwr.next_offset
        if not mwr.valid:
            raise ValueError("Magic Word of trace file is not valid (!= TRAC)")

        jbr: JsonBlobResult = parse_json_blob(self.__file_data, current_offset)
        current_offset = jbr.next_offset

        if arch is None:
            self.__arch = jbr.detected_arch

        if self.__arch == Architecture.UNKNOWN:
            raise NotImplementedError(
                "trace file architecture neither specified or able to be automatically detected"
            )

        self.__trace_data_offset_start: int = current_offset
Where the file is parsed for preliminaries, for example detecting a known architecture, and finally finding a point where the binary trace data blocks would continue.
Those binary trace data blocks then become consumable for instruction execution variants through a property that acts as a Generator, allowing for efficient iteration over the binary data on-the-fly as opposed to fully lifting all binary data at once into a list of some sort.
    @property
    def binary_trace_data_blocks(
        self,
    ) -> Generator[
        Tuple[InstructionExecutionContext, InstructionExecutionBlockResult]
        | CustomBlockResult
    ]:

        exec_ctx = InstructionExecutionContext(self.__arch)

        current_offset: int = self.__trace_data_offset_start

        while current_offset < len(self.__file_data):
            btdbr: InstructionExecutionBlockResult | CustomBlockResult | None = (
                parse_binary_trace_data_block(
                    self.__file_data, current_offset, self.__arch
                )
            )

            if isinstance(btdbr, InstructionExecutionBlockResult):
                iebr: InstructionExecutionBlockResult = btdbr
                current_offset = iebr.next_offset
                exec_ctx.process_instruction(iebr)
                yield (exec_ctx, iebr)
            elif isinstance(btdbr, CustomBlockResult):
                cbr: CustomBlockResult = btdbr
                current_offset = cbr.next_offset
                yield cbr
            else:
                break
Walking the Instruction Executions
The generic loop goes like this:
    # ...

    status: Status = Status.FIRST_INSTR
    instr_exec_block_count: int = 0
    custom_data_block_count: int = 0
    instr_mnemonic_counts: Dict[str, int] = {}

    prev_block_addr: int = 0
    prev_block_instrs: List[iced_x86.Instruction] = []
    prev_block_exists: bool = False

    current_block_addr: int = 0
    current_block_instrs: List[iced_x86.Instruction] = []

    for btdb in tf.binary_trace_data_blocks:
        if isinstance(btdb, tuple):
            iectx: InstructionExecutionContext = btdb[0]
            iebr: InstructionExecutionBlockResult = btdb[1]

            match status:
                case Status.FIRST_INSTR:
                    current_block_addr = iectx.last_instruction_ip
                    current_block_instrs.clear()
                case Status.BLOCK_ANEW:
                    if not prev_block_exists:
                        # this really only happens on our first time around the block...
                        prev_block_exists = True
                        prev_block_addr = current_block_addr
                        prev_block_instrs = current_block_instrs
                        current_block_instrs = []
                        current_block_addr = iectx.last_instruction_ip
                    else:
                        # the regular case...

                        # we need to create an edge between the two blocks!
                        cfg.create_edge(
                            prev_block_addr,
                            prev_block_instrs,
                            current_block_addr,
                            current_block_instrs,
                        )

                        # and then clear house for the new!!!
                        prev_block_exists = True
                        prev_block_addr = current_block_addr
                        prev_block_instrs = current_block_instrs
                        current_block_instrs = []
                        current_block_addr = iectx.last_instruction_ip

                    status = Status.REGULAR

                case Status.REGULAR:
                    pass

            instr = dec.decode(iebr.opcode_offset, iectx.last_instruction_ip)
            current_block_instrs.append(instr)

            mnem: str = formatter.format_mnemonic(instr)
            if instr_mnemonic_counts.get(mnem) is None:
                instr_mnemonic_counts[mnem] = 1
            else:
                instr_mnemonic_counts[mnem] += 1

            if (
                instr.flow_control != iced_x86.FlowControl.NEXT
                or instr_writes_any_memory(info_factory.info(instr))
            ):
                status = Status.BLOCK_ANEW

            instr_exec_block_count += 1
        elif isinstance(btdb, CustomBlockResult):
            custom_data_block_count += 1
During this loop, a graph is constructed iteratively.
The general idea is to walk for branches and lazily stitch them together as progress through the trace file is made.
There are some caveats though to gathering control flow from a trace. A trace can end at any given point, even before a terminating instruction has been reached.
Therefore, even after the loop, some cleanup chores are performed just in case of a straggling node, to ensure the graph is complete. One such instance could be where there is only one block, or someone did not even reach a branching instruction during their trace that would terminate the current block, or even at all.
Graph Construction
The graph implementation is an honest mess, and could use some optimizing.
When constructing the graph, care is taken to split on any instruction that does not simply step forward to the next.
But in addition, I split on instructions that mutate memory as well. This is because any instruction that writes to memory could potentially modify code.
def instr_writes_any_memory(inst_nfo: iced_x86.InstructionInfo) -> bool:
    for um in inst_nfo.used_memory():
        if (
            um.access == iced_x86.OpAccess.COND_WRITE
            or um.access == iced_x86.OpAccess.READ_COND_WRITE
            or um.access == iced_x86.OpAccess.READ_WRITE
            or um.access == iced_x86.OpAccess.WRITE
        ):
            return True
    return False
Hence, the reason why I set the status to BLOCK_ANEW on the following condition,
if (
                instr.flow_control != iced_x86.FlowControl.NEXT
                or instr_writes_any_memory(info_factory.info(instr))
            ):
                status = Status.BLOCK_ANEW
However, there is more to it than that.
More on Support for Self-Modifying Code (SMC)
There is the case where basic blocks could reside at the same address, but contain different instructions than they previously had.
In order to account for this, I compare basic blocks on the bit level, and store all variants. This means that when edges are created to basic blocks, they are edges that are created on specific variants of basic blocks, rather than just from address-to-address.
    def __iced_instrs_eq(
        self, a: iced_x86.Instruction, b: iced_x86.Instruction
    ) -> bool:
        return a.eq_all_bits(b)

    def __blocks_eq(
        self, a: List[iced_x86.Instruction], b: List[iced_x86.Instruction]
    ) -> bool:
        if len(a) != len(b):
            return False

        for i in range(len(a)):
            if not self.__iced_instrs_eq(a[i], b[i]):
                return False

        return True
Arguments
The script is highly configurable. Here is the page of information displayed when a help option -h is specified.
usage: x64dbg Trace Viz [-h] -f FILENAME -format RENDER_OUTPUT_FORMAT -nodeshape NODE_SHAPE -opaque_bbs OPAQUE_BBS
                        -hf HOMOGENIZE_FLOW

Renders a directed control flow graph of the execution flow that occurred at runtime recorded by an x64dbg trace

options:
  -h, --help            show this help message and exit
  -f, -filename, --filename FILENAME
                        Specifies the path of the trace file
  -format, --format, -fmt, --fmt RENDER_OUTPUT_FORMAT
                        Specifies the type of output when rendering e.g. SVG,PNG,PDF
  -nodeshape, --nodeshape NODE_SHAPE
                        Specifies the shape of the nodes representing the basic blocks on the graph, e.g.
                        box,ellipse,oval,square,box3d,component,tab,folder,note,cds,cylinder,invhouse,plaintext,plain
  -opaque_bbs, --opaque_bbs, -obb OPAQUE_BBS
                        When enabled (True instead of False), basic blocks do not include rendered within them the
                        formatted disassembly of its contained instructions
  -hf, -homogenize_flow, --homogenize_flow HOMOGENIZE_FLOW
                        When enabled (True instead of False), repeat edges during control flow are not considered
                        unique.

-- author: www.terraphax.com --
In hindsight, the script should also be supporting the case where someone traced through the instructions on an AMD processor, and have a switch for enabling the AMD-specific encodings supported by the instruction decoder. But, there is a chance that x64dbg might not be doing that either. Also the enablement or opposite direction for ISA extensions that may or may not be supported by the processor that gathered the runtime trace.
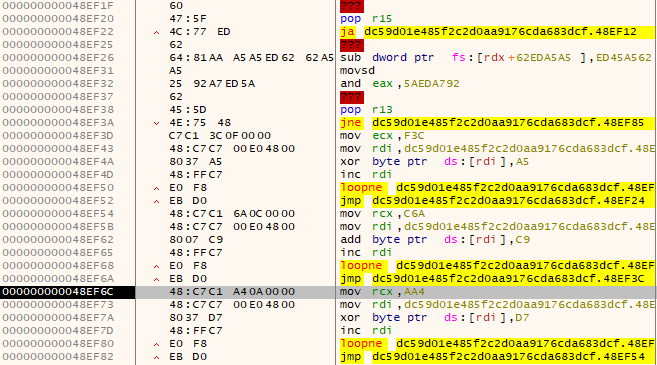
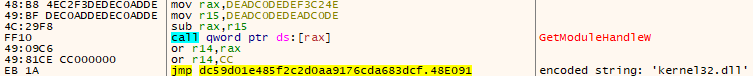
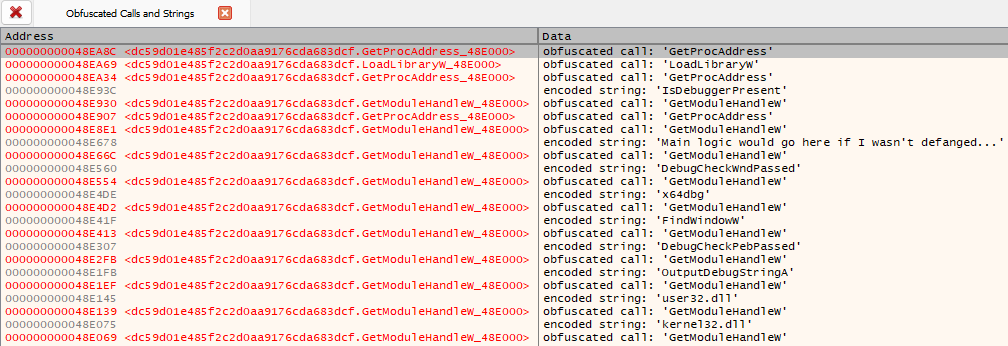
Results
Finally, some of the results in the form of graph renditions will be shared below. Many are graphs of obfuscated code.


How can x64dbg’s GUI be Improved?
The view of a trace file provided by x64dbg’s GUI can be improved in a few simple ways. All of which pertain to providing the user with greater access to the already rich amount of information contained in the binary.
Anyway, here would be the list:
- Allow the user to search for specific instructions (e.g. RDTSC)
- Allow the user to search for when thread ID changes (i.e. execution of a different thread is being recorded)
- Allow explicit choice of CPU vendor mode to AMD or Intel, and certain available ISA extensions for adjusting the instruction decoder to match the users current hardware (e.g. on some hardware
LZCNTwill instead be aBSR). These capabilities of the end-user hardware can also be automatically detected by x64dbg on startup, and embedded as metadata in the trace file JSON blob.
And here are some things that the user might not already expect x64dbg to support, due to not having explored the GUI fully:
- The memory access information of the trace file can be searched through the
Xrefaction in the right click menu when in the trace view. More on this feature can even be found in an unpublished blog article by torusrxxx which can be found here.
Beyond that, in the code base there are remnants of a TO-DO feature for implementing AVX512, which currently the trace files will not track the register changes for those wider registers.
And, AVX512 will be old news soon with APX on the horizon (or maybe it is already here? I find it difficult to keep up with the news…). The REGISTERCONTEXT structures will need some updating, and so will trace file implementations. Though, there might not even be a Windows API function yet that would enable one to fetch the contents of those newly added general purpose registers. Maybe it will be called GetThreadContextEx, haha. Though, APX will require more than updates to the trace file, even the main CPU interface we all know and love for just stepping through a program will need to display more registers in the context pane.
It will be interesting to see how compatibility is managed. Or maybe I am just being ridiculous as usual.
Acknowledgment
Thanks to mrexodia and torusrxxx for their feedback on the blog post during its draft phase before publishing.
Signing Off
Closing out this post now…
Enjoy the eye candy that x64dbg allows you to create,
-Austin.