Analysis at Scale with x64dbg Automate
04 Mar 2025, by darbonzo[This post was written by Darius Houle (darbonzo), if you want to post on this blog you can! Go here for more information…]
In this article I’ll be showcasing some of the thoughts and features behind x64dbg Automate, my automation solution for x64dbg. I designed this project with the goal of building on x64dbg’s command execution engine and plugin API to provide an expressive, modern, and easy to use Python client library. I use this project in a wide variety of malware analysis, reverse engineering, and vulnerability hunting tasks.
Background: Why Automate?
If you were to ask me to describe the core of what automation helps me solve, it boils down to a handful of things:
- Reducing repetitive strain
- Tackling complexity
- Scaling workflows and analysis
- Collaboration (reproducibility)
I like showing much more than talking though, so let’s see how automation can help us in each of these areas using some real-world inspired demonstrations.
Dynamic Analysis of a Malware Family
Let’s pose a scenario where we have a large collection malware samples, and we’d like to:
- Identify common family samples that employ a specific payload deployment methodology
- Create reusable tools for entrypoint discovery, deobfuscation, and anti-debug bypass
- Create reusable tools for basic analysis tasks (annotation, extracting strings, and discovering intermodular calls)
A de-fanged sample used for demonstration is available here (password: x64dbg), for any interested readers who would like to follow along. The sample is intentionally simplified for the sake of demonstration, but I’d encourage extrapolation to the bigger picture.
A Quick Look Under the Hood
We’ll start the demonstration with quick peek at a target sample. Examining it shows a malware family that embeds its payload in legitimate MSVC compiled binaries (in our case 7z.exe). Note the clobbered c-runtime _initterm callback used to deploy the rogue payload.

The payload itself has:
- a matryoshka-esque self-decryption mechanism
- some basic anti-debug

- encrypted strings (sorry, FLOSS won’t help here 🫠)

- obfuscated intermodular calls

I’ll leave exploration of the sample up to readers, and focus on the automation aspects of the exercise from here out.
Identifying Targets
Earlier we posed that we have many samples that may or may not be of the target family we’re concerned with. As a first step let’s build a method to discover samples we’re interested in, using a basic yara rule.
# Example 1: Use Yara to find samples of interest
import yara
from pathlib import Path

rules_src = """
import "pe"

// Find binaries with suspicious .reloc configuration and loader signature match
rule demo_malware_family
{
    strings:
        $loader_iter = { 48 C7 C7 00 E0 48 00 80 ?? ?? 48 FF C7 E0 F8 EB D0 }
    condition:
        $loader_iter and
        pe.is_pe and
        pe.section_index(".reloc") and
        pe.data_directories[5].size == 0 // IMAGE_DIRECTORY_ENTRY_BASERELOC
}
"""

def sample_match() -> Path:
    rules = yara.compile(source=rules_src)
    for f in Path('samples').iterdir():
        if f.is_file() and rules.match(str(f)):
            yield f

if __name__ == "__main__":
    print(next(sample_match()))
    # Output:
    #   PS E:\re\automate-demo> python .\automate.py
    #   samples\dc59d01e485f2c2d0aa9176cda683dcf.exe
Automated Entrypoint Discovery
Frequently I find myself in a situation where I’ve taken many steps to land in a certain execution state. This is common when I am unpacking an armored sample. When this is the case, I want to maximize the amount of analysis I can do at that specific point in execution. There are ways to tackle this, which I have varying success with (e.g. Time-Travel-Debugging). However, I usually find myself most productive when I script my steps and replay execution at-will.
The next time you’re traversing an armored binary, think about the points in execution you’d find it helpful to rapid-replay to. This is a foundational use case for debug automation. We’ll show what that can look like at a small scale with our sample:
# Example 2: Navigate the layered decryption and discover the payloads entrypoint
# For brevity only new code is shown
from x64dbg_automate import X64DbgClient

def seek_payload_entrypoint(client: X64DbgClient):
    # Locate the payloads memory page
    module_base, _ = client.eval_sync("mod.main()")
    payload_mem_page = [mem for mem in client.memmap() if '.reloc' in mem.info
                        and mem.base_address > module_base][0]

    # Set an execution memory breakpoint on the payload's memory page
    client.set_memory_breakpoint(payload_mem_page.base_address, bp_type='x', restore=False)
    client.go() # Run to application entrypoint
    client.wait_until_stopped()
    client.go() # Run to memory breakpoint
    client.wait_until_stopped()

    # Traverse N layers of decryption to find the entrypoint
    while True:
        addr = client.get_reg('rip')

        # Make sure we haven't ended up outside the decryption function
        if addr < payload_mem_page.base_address \
            or addr >= payload_mem_page.base_address + payload_mem_page.region_size:
            raise ValueError('Walking decryption was not successful, rip outside of expected bounds')

        # If the instruction is not "mov rcx, XYZ" after a cycle, we've found the entrypoint
        ins = client.disassemble_at(addr)
        if not ins.instruction.startswith('mov rcx,'):
            break

        # Otherwise, run this iteration and step into the next one
        while True:
            addr += ins.instr_size
            ins = client.disassemble_at(addr)
            if ins.instruction.startswith('jmp'):
                client.set_breakpoint(addr, singleshoot=True)
                client.go()
                client.wait_until_stopped()
                client.stepi()
                break

    # We are now free to analyze the payload at the entrypoint
    client.stepi()

if __name__ == "__main__":
    # ...
    client = X64DbgClient(r'E:\re\x64dbg_dev\release\x64\x64dbg.exe')
    client.start_session(str(sample))
    seek_payload_entrypoint(client)
    client.detach_session()
The automation brings us to a point where we can disconnect our client and do additional analysis on the payload itself. With the heavy lifting of getting past the payload’s decryption out of the way we can debug fearlessly, knowing we’ll always be able to get back to important spots easily.
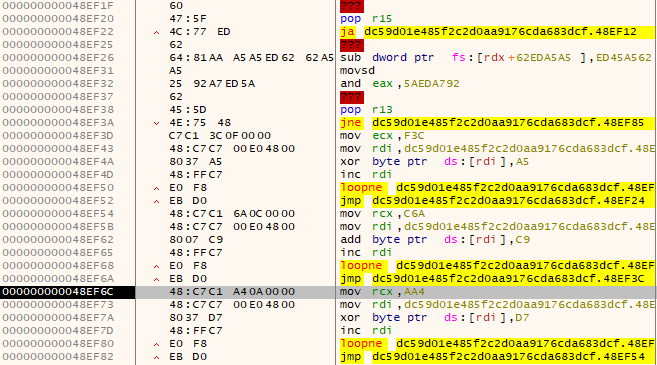
Annotating the Payload
Examining our sample at the entrypoint reveals some repeatable signatures that can be used to discover strings and calls. Analysts know the repetitive pain of reverse engineering strings and intermodular calls for the hundredth time. Using repeatable and repurposable automation to annotate strings and label calls can make the task less tedious. Let’s see what that looks like for our sample:
# Example 3: Annotate the payload with helpful string and call hints
# For brevity only new code is shown
from x64dbg_automate.models import ReferenceViewRef
def annotate_strings_and_calls(client: X64DbgClient):
mem = client.virt_query(client.get_reg('rip'))
payload = client.read_memory(mem.base_address, mem.region_size)
refs = []
# Search for string decryptors by pattern
obf_string_pattern = bytes.fromhex('49 09 C6 49 81 CE CC 00 00 00 EB')
for i in range(len(payload) - len(obf_string_pattern)):
if payload[i:i + len(obf_string_pattern)] == obf_string_pattern:
# Extract the location, size, bytes, and character width
str_loc = i + len(obf_string_pattern) + 1
str_size = payload[str_loc - 1]
obf_str = bytearray(payload[str_loc:str_loc + str_size])
char_size = int(obf_str[-3:] == b'\x00\x00\x00') + 1
# Decrypt the string and annotate it
for ix, i in enumerate(range(0, len(obf_str) - char_size, char_size)):
obf_str[i] = (obf_str[i] - (0xCC + (ix * 13))) & 0xFF
if char_size == 2:
obf_str = obf_str.decode('utf-16-le').rstrip('\x00')
else:
obf_str = obf_str[0:-2].decode()
client.set_comment_at(mem.base_address + str_loc - 2, f"encoded string: '{obf_str}'")
refs.append(ReferenceViewRef(
address=mem.base_address + str_loc - 2,
text=f"encoded string: '{obf_str}'"
))
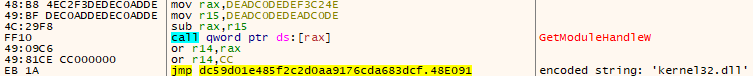
# Search for obfuscated intermodular calls by pattern
obf_call_pattern = bytes.fromhex('49 BF DE C0 AD DE DE C0 AD DE')
for i in range(len(payload) - len(obf_string_pattern)):
if payload[i:i + len(obf_call_pattern)] == obf_call_pattern:
# Reverse the obfuscation
obf_call_qw = client.read_qword(mem.base_address + i - 8)
obf_call_qw = (obf_call_qw - 0xDEADC0DEDEADC0DE) & 0xFFFFFFFFFFFFFFFF
# Resolve the symbol at the call destination and annotate
resolved_sym = client.get_symbol_at(obf_call_qw)
client.set_label_at(mem.base_address + i + 13, f'{resolved_sym.decoratedSymbol}_{mem.base_address:X}')
refs.append(ReferenceViewRef(
address=mem.base_address + i + 13,
text=f"obfuscated call: '{resolved_sym.decoratedSymbol}'"
))
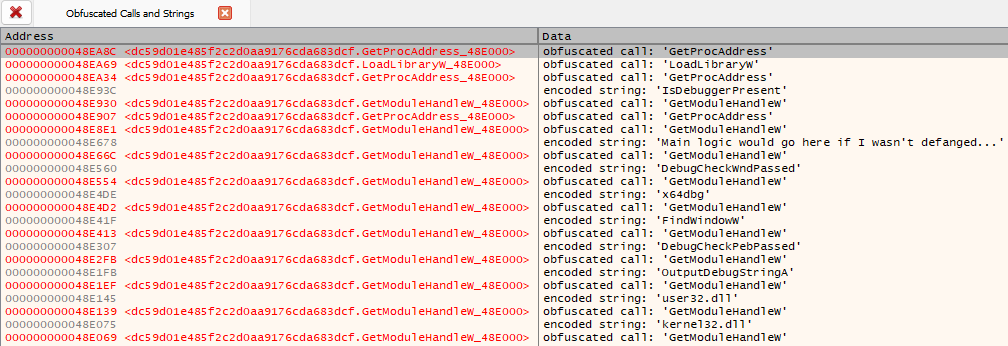
# Populate a reference view in the GUI with the found strings and calls
client.gui_show_reference_view("Obfuscated Calls and Strings", refs)
if __name__ == "__main__":
# ...
annotate_strings_and_calls(client)
client.detach_session()
The result of this is a boon of helpful hints saved to our application database. The more samples in this family of malware we analyze, the greater the value of having analysis automated ends up being.
Additionally, we can see a reference view populated with a summary of the findings.
Bypassing Anti-Debug
Stepping through the payload at this point reveals two anti-debug measures. Let’s modify our script to seek past anti-debug checks in addition to decryption, so we can debug fully unencumbered.
# Example 4: Circumvent and navigate past anti-debug
# For brevity only new code is shown

def bypass_anti_debug(client: X64DbgClient):
    client.hide_debugger_peb() # Bypass basic anti-debugging technique

    # Bypass FindWindowW anti-debugging technique
    # Wait for user32 to be loaded
    addr, _ = client.eval_sync('LoadLibraryExW')
    client.set_breakpoint(addr, singleshoot=True)

    # Wait for FindWindowW to be called with 'x64dbg' as an argument
    addr, _ = client.eval_sync('FindWindowW')
    client.set_breakpoint(addr, singleshoot=True)
    client.go()
    client.wait_until_stopped()
    if client.read_memory(client.get_reg('rdx'), 12) != 'x64dbg'.encode('utf-16-le'):
        raise ValueError("Expected FindWindowW to be looking for x64dbg")

    # Force FindWindowW to return NULL
    client.write_memory(client.get_reg('rdx'), 'zzz'.encode('utf-16-le'))

    # Return to caller
    client.ret()
    client.stepi()


if __name__ == "__main__":
    # ...
    bypass_anti_debug(client)
    client.detach_session()
Putting it all Together
Walking through this exercise showed us some powerful use-cases for x64dbg Automate. We scripted the entirety of our analysis, letting us access tricky execution states breezily. We also recorded our steps in a reliably reproducible way, opening the door for re-use, adaptation, and collaboration.
The exercise was very much geared towards Malware analysts, but the concepts within are applicable regardless of the specific discipline you’re operating in.
With that I’ll wrap up sharing. I hope you’ll consider heading to Automate’s installation and quickstart for one of your upcoming projects! 🎉