Introducing Contemporary Reverse Engineering Techniques to Real World Use
09 Jul 2016, by AnonymousHow do we reverse engineer a program these days?
For many guys, reverse engineering is just a simple NOP – Set a breakpoint on MessageBox, run, then trace back the stack and revert some conditional jumps. But when we are faced with more programs, things change.
Programs are different. When viewed from disassembly, they have clearly different styles. Normal programs just execute minimal and fastest instructions, have good procedure boundaries, and are easy to read. Malwares are complex objects. They run multi-threaded, jump everywhere, do whatever crazy things, and try to infect as many processes as possible. As to commercial DRM applications, they employ heavy code integrity checks, complex virtualized code and even custom compilers, to make their secrets as stealth as possible. Modern virus employs polymorphic code and metamorphic code to keep all its code secret, making life harder for analyst than ever before.
With these protections, the difficulty of reverse engineering is increased dramatically. We often step a program for hours, watching the program counter jumping crazily, and finally get lost in a virtualized world. Then we begin looking for an unpack script online. But if there is none, what to do next? Give up?
Well, if you are smart enough, you can probably focus on what the program is doing, and get a general idea about the protection, such as its calling convention and virtual table structure. Then you write a script yourself to remove all of those tricky codes. As more and more scripts execute, the disassembly view becomes cleaner and cleaner. You start documenting its algorithm elsewhere, and finally write a program that fully devirtualizes the malware or gets the pseudo-code of the program.
In conclusion, as anti-debugging technology advance, you are now facing millions of anti-debugging tricks that are added by the compiler instead of by hand. Traditional “stepping and looking around” is not working anymore.
Automation and analysis are more important
As mentioned above, you cannot follow the traditional work flow when you want to debug a program with a modern protection. You have to remember: you are fighting against a machine. You must write some automated code for every operation you want to perform so that they are applied to millions of similar tricks everywhere in the program instead of just the one you are looking at. You have to be very clear about what the protection does.
Then, you will need analysis. Analysis can give you important information. With analysis, you are clear about what the program is doing and how its control flow is transferring. Machine generated analysis is proven useful during the process of reverse engineering. But it is stupid - easily defeated by simple anti-analysis tricks such as making use of a custom calling convention. You can write a custom analyzer, but it is going to be taking long time and error-prone. Programs are dynamic. Data and code can be modified at any time, threads can be started anywhere, and you will never know how the program executes an RDTSC instruction without your awareness, probably in a procedure you carelessly stepped over. We need analysis desperately, especially dynamic ones.
Introducing dynamic analysis
Trace record is the second major feature I contributed to x64dbg, just after conditional breakpoints. You probably have tried it. But besides turning instructions green, what does it do actually?
There are 3 modes for trace record currently, namely bit, byte and word. I admit the wording is not clear. Trace record works by allocating a specific structure every byte currently, and probably allocate a variable-length list to record instruction-specific information in the future trace record modes. In bit mode, it turns the bit to 1 if the byte is executed. In byte mode, it records how many times the instruction is executed, and the property of the byte, ie head of the instruction, body of the instruction and tail of the instruction. The word mode just extends the counter to 14 bits.
The heart of trace record is to collect information during a trace. Imagine when the program tries to read a QWORD from some function elsewhere, performs some computation and executes more instructions and finally arrives at the function previously read in a incredible way. You will probably forget that the function is accessed previously. But with trace record, the debugger can inform you what the program did before on this function, so you won’t do some silly things. If we record the instructions previously stepped, we can review the control flow we have executed so far. If the program modifies some data and then jumps there in a function, you now know the function is actually an unpacker. You can think of more usage about the trace record. What is even more powerful is to record the whole program execution, including all memory accesses, system calls and control transfers, which is what I called full trace record.
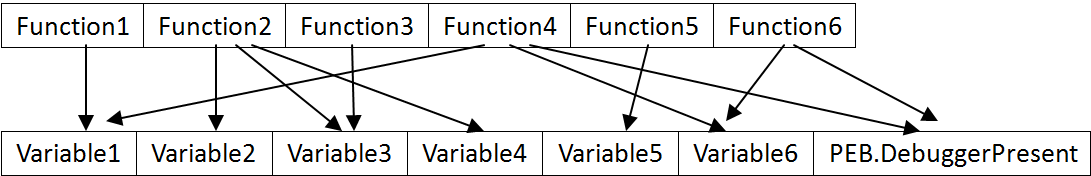
While trace record is useful in debugging, its power is only fully shown when it provides its data to an analyzer. Unlike executable code, trace record is immutable. It represents real program execution process. So, the anti-debugging techniques cannot fool the analyzer now because we have sights into the future. Of course, we can do common optimizations such as dead code elimination and constant folding, draw the real control flow graph and outline its algorithm. But if we dig into the data further, we can find more creative ways to analyze the program. Think we construct a graph associating memory accesses with functions like the picture below:
We can transform the graph to the following graph:
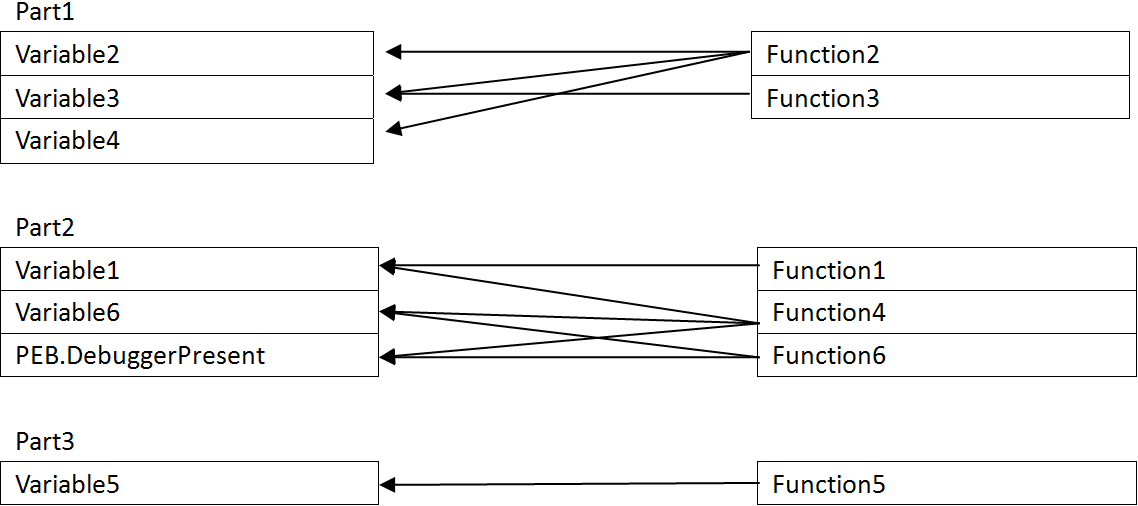
As you can see, there is obvious separation on variable access patterns. Since Part2 of the graph employs some anti-debugging trick, it can be deduced that it must be the protection shell, and the other parts, Part1 and Part3, are likely to be normal functions. Then we can remove specific functions from the control flow and get a cleaner control flow or even unpack it. In real world, there are some connections between protection software and the protected software, but that is minimal, so we can find the minimum cut set of the graph and remove the appropriate branches to separate the program in halves, then the smaller half must be the protection shell. This is just one of the powerful analysis that can accomplished with trace record called minimum cut set analysis.
Another powerful tool is back tracing. Imagine the program is reading a important variable in now, but you have no idea where the variable is written to because the program employs thousands of alias names and switches between multiple stacks, and you didn’t realize its importance that you didn’t set a memory breakpoint on it before. Now, the debugger can tell you where it is accessed last time, and you can then go back to the function that accessed it before.
While full trace record support is strong, it maybe handy to equip the debugger with other types of analyzer, such as cross reference, breakpoint correlation analysis (#802), branch probability analysis (inform user of all indirect or conditional branches that always jump to the same location), hash functions analysis (detect all functions that try to access the code, and construct a pattern of it for use in pattern matching), register marking (when the program read in the code into a register, mark that register as evil, and mark every instruction that reference that register as evil until the register is loaded with another value) and anti-debug trick early warning. With all kinds of analysis, it is easier to get the point of the protection, and easier to write an unpacker or unpack it with the trace record-based universal unpacker/devirtualizer.
Parallel debugging is also worth mentioning. You run two versions of similar software, just modify some variables of it, and then see when and where do their behaviors diverse. It is very simple yet powerful. Another technique worth mentioning is kernel/hypervisor mode debugging. With kernel mode privilege, the debugger can do whatever it wants to do without being detected by the debuggee, thus rendering all the anti-debug patches unnecessary. With kernel mode privilege you can modify the segment descriptor to separate the code memory from the data memory, so that the memory accesses to the code segment is essentially virtualized and you do not have to worry about your software breakpoints being detected. You can even virtualize the entire SSDT, to run the debuggee in a completely isolated environment, control all file and registry access, without the worry about VM detection code, commonly found in malware, being active.
Of course, you will still have to write some scripts. Analyzer is not God. It just gives you enough information to write a script and do pattern matching.
The future of reverse engineering
The methods mentioned above are modern techniques of reverse engineering. It emphasizes on automation, analysis and consciousness. While these techniques are already highlighted in some reverse engineering scholars and are available in some software, the majority of analysts haven’t tried them. They are simply unavailable on the largest platform, Microsoft Windows. As a result, malwares and Trojans are active on Windows. Some malware authors and DRM vendors wonder whether they will ever become available on Windows. However, as anti-debug techniques can advance, so can debugging techniques. If we just take action to bring all these features into real world, things will definitely change.
x64dbg is an open source debugger. You can easily write plugins and scripts and contribute to the code base. x64dbg has a good design and friendly user interface that shows promise to become a better debugger. I choose x64dbg because it is open source. While x64dbg is not totally satisfying my definition as a good debugger, I can contribute to it to make it better.
While some people are skilled enough to reverse a program without devirtualizing, I just say “No, I cannot tell you its algorithm without devirtualizing it. It’s too boring to analyze manually.” I was once a script kid, then was not, and finally am again. I strongly advise you not to hesitate writing a simple script when you unpack a program, so that you can use it later on another program. If you are facing a problem, don’t wait for anything, just write code for it, and contribute it to the world.