x64dbg

An open-source x64/x32 debugger for windows.


Check out the blog!


Download » Source » Donate

Features

  • Open-source
  • Intuitive and familiar, yet new user interface
  • C-like expression parser
  • Full-featured debugging of DLL and EXE files (TitanEngine)
  • IDA-like sidebar with jump arrows
  • IDA-like instruction token highlighter (highlight registers, etc.)
  • Memory map
  • Symbol view
  • Thread view
  • Source code view
  • Graph view
  • Content-sensitive register view
  • Fully customizable color scheme
  • Dynamically recognize modules and strings
  • Import reconstructor integrated (Scylla)
  • Fast disassembler (Zydis)
  • User database (JSON) for comments, labels, bookmarks, etc.
  • Plugin support with growing API
  • Extendable, debuggable scripting language for automation
  • Multi-datatype memory dump
  • Basic debug symbol (PDB) support
  • Dynamic stack view
  • Built-in assembler (XEDParse/asmjit)
  • Executable patching
  • Analysis

Overview

Active development

x64dbg is under constant active development.

GPLv3

We provide both the executable and the source. Feel free to contribute.

Customizable

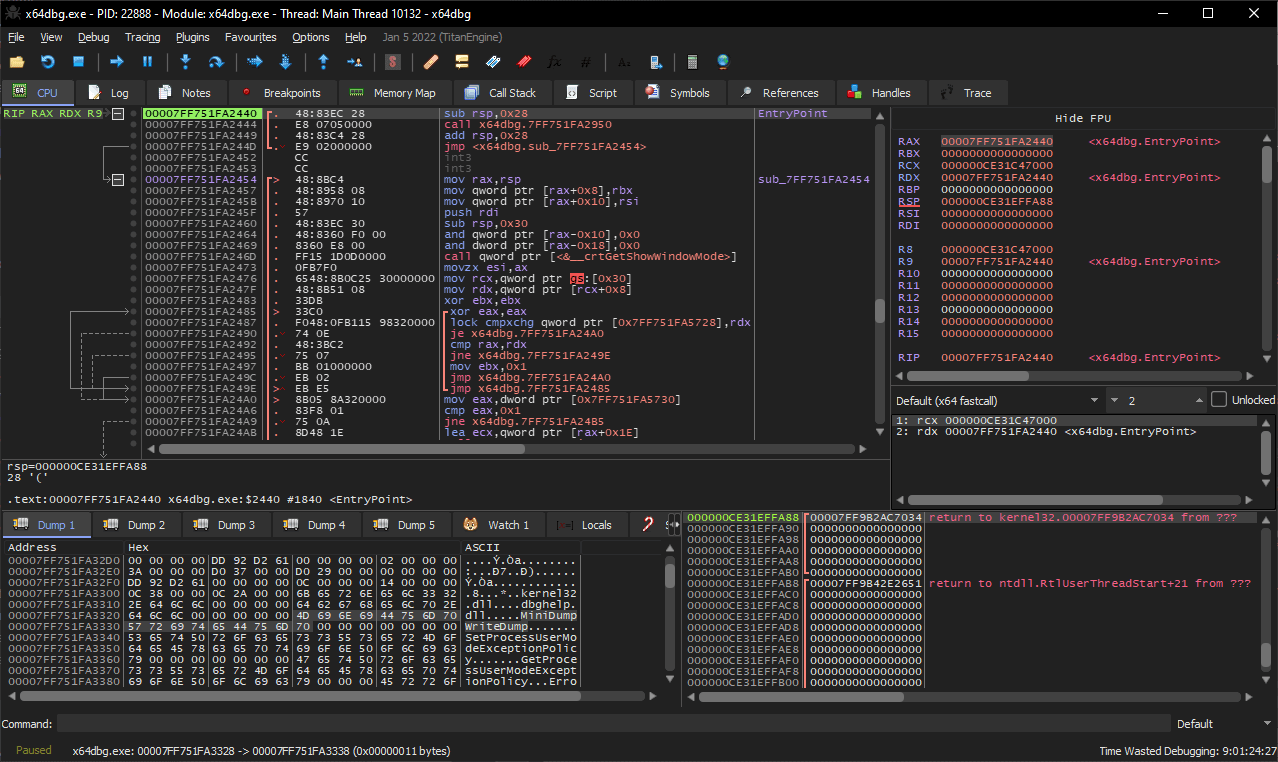
Write plugins in C++, change colors and tweak your preferences.

x64/x32 support

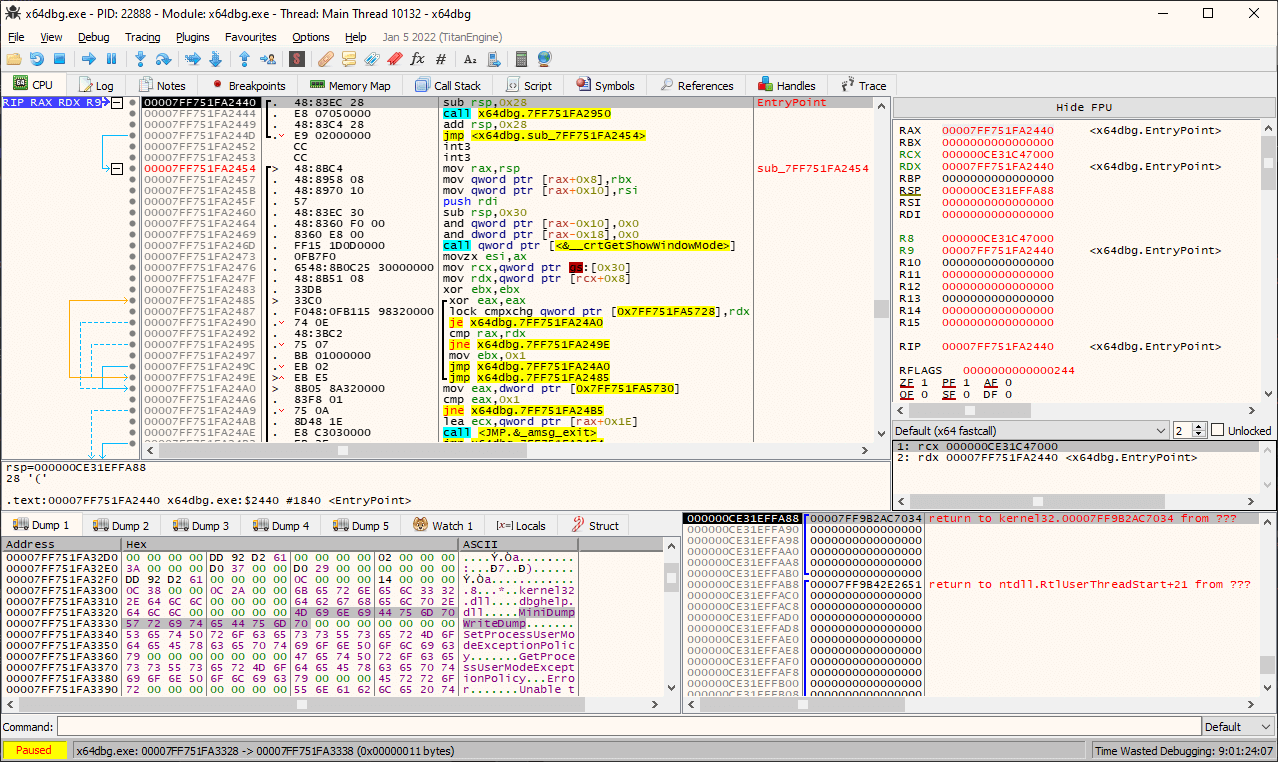
x64dbg can debug both x64 and x32 applications. There is only one interface.

Built on open-source libraries

x64dbg uses Qt, TitanEngine, Zydis, Yara, Scylla, Jansson, lz4, XEDParse, asmjit and snowman.

Simple, powerful development

x64dbg uses C++ and Qt to quickly add new features.

Scriptable

x64dbg has an integrated, debuggable, ASM-like scripting language.

Community-aware

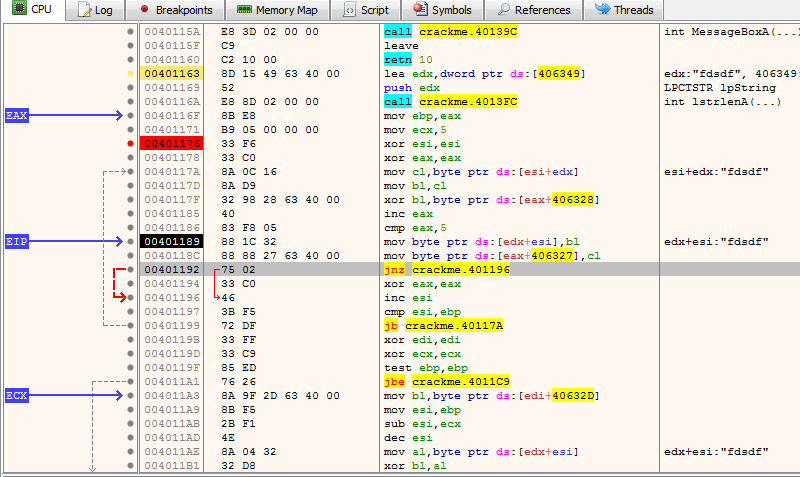
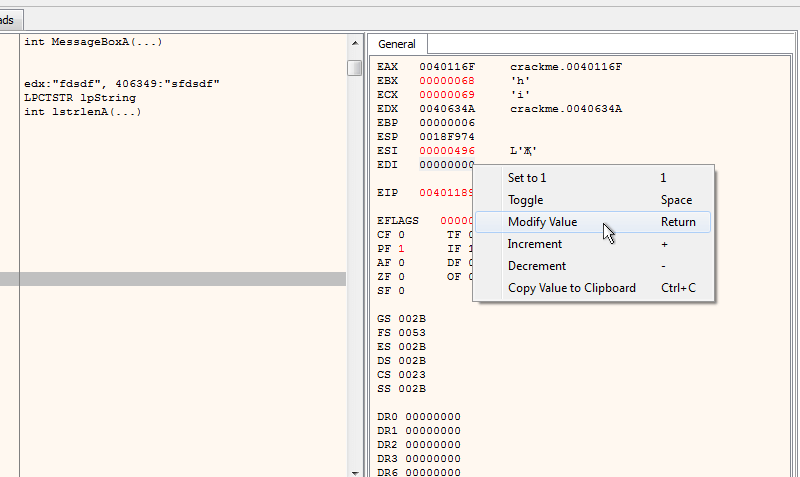
x64dbg has many features thought of or implemented by the reversing community.

Extendable

Write plugins to add script commands or to integrate your tools.

Credits

You can find a more exhaustive list of contributers on the wiki.

Contact